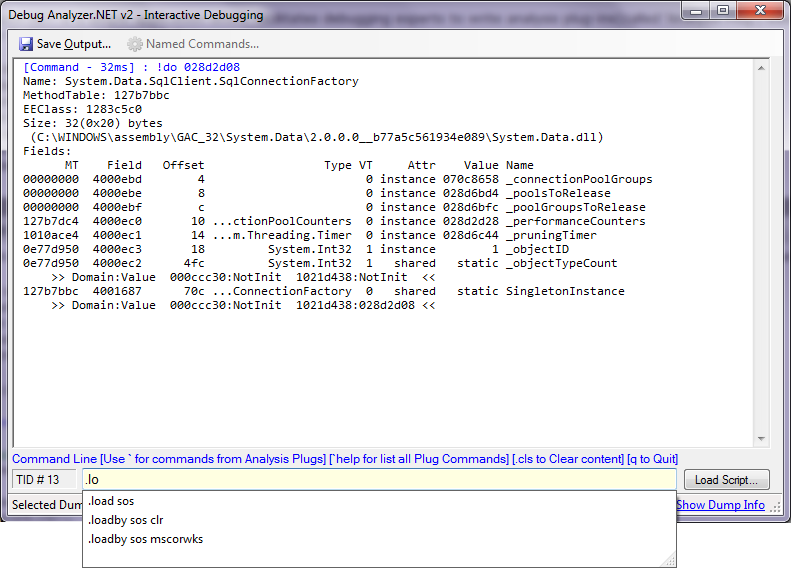
Interactive Debugging feature provides a way for you to manually debug the memory dumps like you do normally. It also provides a way to save the output in RTF format so that you can use it for reference later.
The main benefit of Interactive Debugging is that it enables you to create .NET based commands, equivalent to Debugger Extension commands called 'Command Plugs'.
This feature is still work-in-progress so currently this feature supports only basic debugger commands.

More features in the pipeline... hold your thoughts!